Pages: 1 [2] 3 4 ... 6   Go Down

Author Topic: How much sensor resolution do we need to match our lenses?  (Read 29730 times)

Jim Kasson

  • Sr. Member
  • ****
  • Offline Offline
  • Posts: 2370
    • The Last Word
Re: How much sensor resolution do we need to match our lenses?
« Reply #21 on: May 10, 2014, 01:00:59 pm »

I have not seen Jack Hogan's presampling method. Do you have a link?

Bill, take a look here:

http://www.dpreview.com/forums/post/53643731

Look at the blue dotted curve in the second figure, which Jack says models the AA filter in the Nikon 610.

Jim

EinstStein

  • Sr. Member
  • ****
  • Offline Offline
  • Posts: 501
Re: How much sensor resolution do we need to match our lenses?
« Reply #22 on: May 11, 2014, 03:47:17 pm »

Are you sure you don't mean, "If the lens can resolve 100 line pairs in 1 mm, the lens resolving power has spatial wave length =10um."

Jim

Wave length is the distance from one peak to the next peak. So if there are 100 lines in 1 mm, the wave length is 1mm/100 = 10um.
If it's 100 line pairs in 1mm, it's 00 lines in 1mm. The wavelength will be 5um.

For a discrete sampling system, the pixel to pixel distance should be half the object half wavelength.
So, for 100 lines/mm, the sensor's pixel to pixel space should be 5um, and for 100 line pairs, it would be 2.5um.
Logged

ErikKaffehr

  • Sr. Member
  • ****
  • Offline Offline
  • Posts: 11311
    • Echophoto
Re: How much sensor resolution do we need to match our lenses?
« Reply #23 on: May 11, 2014, 03:59:00 pm »

I guess you are discussing the length of different waves. Jim mean the wave length of green light.

Best regards
Erik


Wave length is the distance from one peak to the next peak. So if there are 100 lines in 1 mm, the wave length is 1mm/100 = 10um.
If it's 100 line pairs in 1mm, it's 00 lines in 1mm. The wavelength will be 5um.

For a discrete sampling system, the pixel to pixel distance should be half the object half wavelength.
So, for 100 lines/mm, the sensor's pixel to pixel space should be 5um, and for 100 line pairs, it would be 2.5um.
Logged
Erik Kaffehr
 

Jim Kasson

  • Sr. Member
  • ****
  • Offline Offline
  • Posts: 2370
    • The Last Word
Re: How much sensor resolution do we need to match our lenses?
« Reply #24 on: May 11, 2014, 03:59:53 pm »

Wave length is the distance from one peak to the next peak. So if there are 100 lines in 1 mm, the wave length is 1mm/100 = 10um.
If it's 100 line pairs in 1mm, it's 00 lines in 1mm. The wavelength will be 5um.

For a discrete sampling system, the pixel to pixel distance should be half the object half wavelength.
So, for 100 lines/mm, the sensor's pixel to pixel space should be 5um, and for 100 line pairs, it would be 2.5um.

Uh, a line pair is one light line and one dark line. Thus one cycle.

Jim

Jim Kasson

  • Sr. Member
  • ****
  • Offline Offline
  • Posts: 2370
    • The Last Word
Re: How much sensor resolution do we need to match our lenses?
« Reply #25 on: May 11, 2014, 04:02:15 pm »

I guess you are discussing the length of different waves. Jim mean the wave length of green light.

Not in this case, Erik. We're talking about spatial wavelengths and spatial frequencies in test targets.

[Added: and I think we're mostly talking about definitions, not sampling theory. But I could be wrong. We'll get it sorted out.]

Jim
« Last Edit: May 11, 2014, 04:19:45 pm by Jim Kasson »
Logged

ErikKaffehr

  • Sr. Member
  • ****
  • Offline Offline
  • Posts: 11311
    • Echophoto
Re: How much sensor resolution do we need to match our lenses?
« Reply #26 on: May 11, 2014, 04:08:55 pm »

OK! Sorry!

Best regards
Erik

Not in this case, Erik. We're talking about spatial wavelengths and spatial frequencies in test targets.

Jim
« Last Edit: May 11, 2014, 04:21:50 pm by ErikKaffehr »
Logged
Erik Kaffehr
 

Jim Kasson

  • Sr. Member
  • ****
  • Offline Offline
  • Posts: 2370
    • The Last Word
Pictures!
« Reply #27 on: May 11, 2014, 04:31:10 pm »

Here are four images off the camera simulator. ISO 12233 target, with the white point at 200 and the black point at 55 to make sure there’s no clipping. Perfect, diffraction-limited lens set at f/8. 550 nm light used to calculate diffraction, even for the red and blue planes. Kernel used for diffraction convolution 4 times as wide and tall as the Sparrow distance. No vibration, no focus errors, no photon noise. 14 bit perfect ADCs in the camera. 100% fill factor. The camera's primaries are the AdobeRGB primaries. Sensor dimensions are 3840 um x 2560 um. Bilinear interpolation for demosaicing. As Q goes up, the sensels get smaller, and there are more of them.

[Added: RGGB Bayer CFA with the Adobe RGB primaries as the sensel wavelength-sensitivity-corrected dye set.]

You may want to look at the images at actual size. I'll put links in another post.

Q = 1:


Q = 1.414:


Q = 2:


Q = 2.828


The false color artifacts are, not surprisingly, worse when the target values go from 0 to 255.

I'll be doing some slanted edge MTF analysis.

Jim
« Last Edit: May 11, 2014, 04:40:54 pm by Jim Kasson »
Logged

Jim Kasson

  • Sr. Member
  • ****
  • Offline Offline
  • Posts: 2370
    • The Last Word
Links to full-sized ISO 12233 images
« Reply #28 on: May 11, 2014, 04:37:19 pm »

Here are links to full sized versions of the images from the preceding post.

Q=1

Q=1.414

Q=2

Q=2.828

Jim

ErikKaffehr

  • Sr. Member
  • ****
  • Offline Offline
  • Posts: 11311
    • Echophoto
Re: Pictures!
« Reply #29 on: May 11, 2014, 04:38:11 pm »

Great Work!

Erik

Here are four images off the camera simulator. ISO 12233 target, with the white point at 200 and the black point at 55 to make sure there’s no clipping. Perfect, diffraction-limited lens set at f/8. 550 nm light used to calculate diffraction, even for the red and blue planes. Kernel used for diffraction convolution 4 times as wide and tall as the Sparrow distance. No vibration, no focus errors, no photon noise. 14 bit perfect ADCs in the camera. 100% fill factor. The camera's primaries are the AdobeRGB primaries. Sensor dimensions are 3840 um x 2560 um. Bilinear interpolation for demosaicing. As Q goes up, the sensels get smaller, and there are more of them.

You may want to look at the images at actual size. I'll put links in another post.

Q = 1:


Q = 1.414:


Q = 2:


Q = 2.828


The false color artifacts are, not surprisingly, worse when the target values go from 0 to 255.

I'll be doing some slanated edge MTF analysis.

Jim
Logged
Erik Kaffehr
 

Jim Kasson

  • Sr. Member
  • ****
  • Offline Offline
  • Posts: 2370
    • The Last Word
Slanted edge results delayed
« Reply #30 on: May 11, 2014, 04:50:43 pm »

I got a clipping warning from Imatest when I tried to do the slanted edge MTF analysis.


I guess I'll have to rerun the sim with an even lower-contrast target.

Jim

EinstStein

  • Sr. Member
  • ****
  • Offline Offline
  • Posts: 501
Re: How much sensor resolution do we need to match our lenses?
« Reply #31 on: May 11, 2014, 06:05:25 pm »

>> Uh, a line pair is one light line and one dark line. Thus one cycle.

You may have a better handling in the terminology. That's fine. I still stand with my statement that the spatial wavelength is from peak to the next peak.
I hope no one think its the high peak to the low peak. Yes, when said peak to peak, it means high peak to high peak or low peak to low peak.


Logged

Jim Kasson

  • Sr. Member
  • ****
  • Offline Offline
  • Posts: 2370
    • The Last Word
Re: How much sensor resolution do we need to match our lenses?
« Reply #32 on: May 11, 2014, 06:43:45 pm »

>> Uh, a line pair is one light line and one dark line. Thus one cycle.

You may have a better handling in the terminology. That's fine. I still stand with my statement that the spatial wavelength is from peak to the next peak.
I hope no one think its the high peak to the low peak. Yes, when said peak to peak, it means high peak to high peak or low peak to low peak.

Then we agree.

Jim

Bart_van_der_Wolf

  • Sr. Member
  • ****
  • Offline Offline
  • Posts: 8914
Re: Slanted edge results delayed
« Reply #33 on: May 12, 2014, 04:30:26 am »

I got a clipping warning from Imatest when I tried to do the slanted edge MTF analysis.


I guess I'll have to rerun the sim with an even lower-contrast target.

Hi Jim,

I just started reading this thread, so I won't comment just yet, but I noticed in the Imatest chart that you used a Gamma 2.20, where it is supposed to be 0.454545 (or 0.5, which is also close enough for most comparisons). Just wanted to warn at this stage, before I got through reading everything said so far.

Cheers,
Bart
Logged
== If you do what you did, you'll get what you got. ==

hjulenissen

  • Sr. Member
  • ****
  • Offline Offline
  • Posts: 2051
Re: How much sensor resolution do we need to match our lenses?
« Reply #34 on: May 12, 2014, 04:46:49 am »

That is fine. What does your CFA need to make your raw converter generate 2 distinct spots? The spots may or may not align with your pixels. I would venture that you need peaks at least a diagonal apart.
To the degree that the sampling system adheres to Nyquist, the exact alignment of the spots does not matter, only the continous bandwidth of the signal.

Of course, sampling systems does not adhere strictly to Nyquist, but the combination of diffraction, OLPF, sensel active area, camera movement etc should make alignement less of an issue.

-h
Logged

Bart_van_der_Wolf

  • Sr. Member
  • ****
  • Offline Offline
  • Posts: 8914
Re: How much sensor resolution do we need to match our lenses?
« Reply #35 on: May 12, 2014, 06:04:34 am »

To the degree that the sampling system adheres to Nyquist, the exact alignment of the spots does not matter, only the continous bandwidth of the signal.

Of course, sampling systems does not adhere strictly to Nyquist, but the combination of diffraction, OLPF, sensel active area, camera movement etc should make alignement less of an issue.

Hi,

Correct, as can be determined/verified with my Slanted Edge Evaluation tool. One compares the successive responses of some 10 (in case of a 5.7 degree slant) edge transitions (sample a selection, go 1 line down and 10 positions to the right, resample, ... repeated 10x). This will show at 1/10th of a pixel sub-sampled intervals how the edge transition behaves. A wave indicates phase alignment issues, a more or less level performance indicates insensitivity to sensel alignment (see attached example of my EF 100mm f/2.8L Macro IS).

Cheers,
Bart
Logged
== If you do what you did, you'll get what you got. ==

hjulenissen

  • Sr. Member
  • ****
  • Offline Offline
  • Posts: 2051
Re: How much sensor resolution do we need to match our lenses?
« Reply #36 on: May 12, 2014, 06:56:35 am »

Correct, as can be determined/verified with my Slanted Edge Evaluation tool. One compares the successive responses of some 10 (in case of a 5.7 degree slant) edge transitions (sample a selection, go 1 line down and 10 positions to the right, resample, ... repeated 10x). This will show at 1/10th of a pixel sub-sampled intervals how the edge transition behaves. A wave indicates phase alignment issues, a more or less level performance indicates insensitivity to sensel alignment (see attached example of my EF 100mm f/2.8L Macro IS).
If we go further down this route:
Would not (something like) the D800/A7r (or D7100) with high sensel density and no OLPF be better suited for estimating lens response >fs/2 since they do less prefiltering, than do their OLPF-equipped brethren? By having many (slightly offset, aliased) samples, it ought to be possible to gain information about the MTF of the lens beyond the regular passband of the sensor, thus knowing how (e.g.) your 100mm will perform on a future 54MP FF (or 36MP crop) camera.

Since pixel site area will in itself work as a lowpass filter (and diffraction is inevitable), one might expect the SNR at those spatial frequencies to be low (even for optimal lenses), meaning that a large number of samples might have to be effectively averaged in order to have robust estimates.

I am inspired here by things such as interlacing (where something approaching 480/576 spatial lines can be recreated from a signal that is 240/288 fields, alternately offset by 1/2, provided that there is no other movement). If interlacing had used "Nyquistian perfect" spatial pre-filtering, then there would be no aliasing information from which to recreate the higher-resolution image.

-h
« Last Edit: May 12, 2014, 07:00:02 am by hjulenissen »
Logged

Jim Kasson

  • Sr. Member
  • ****
  • Offline Offline
  • Posts: 2370
    • The Last Word
Re: Slanted edge results delayed
« Reply #37 on: May 12, 2014, 11:42:50 am »

I just started reading this thread, so I won't comment just yet, but I noticed in the Imatest chart that you used a Gamma 2.20, where it is supposed to be 0.454545 (or 0.5, which is also close enough for most comparisons). Just wanted to warn at this stage, before I got through reading everything said so far.

Good catch, Bart. I've no idea how that got there, but I fixed it and reran 
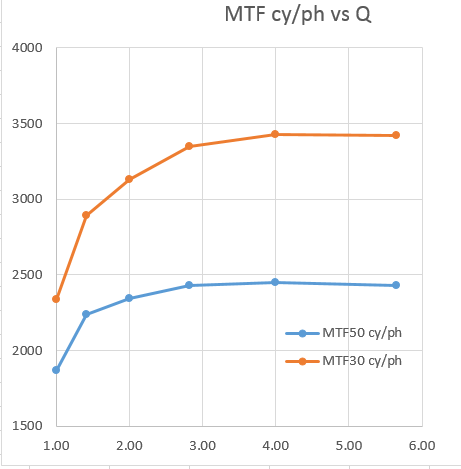
Imatest on a series of slanted edge pictures with lambda = 550 nm, and a diffraction-limited f/8 lens with Q starting at 1 and increasing by a factor of sqrt(2) to 5.7 (hey, why is it that our lenses aren't labeled f/5.7 instead of f/5.6?).

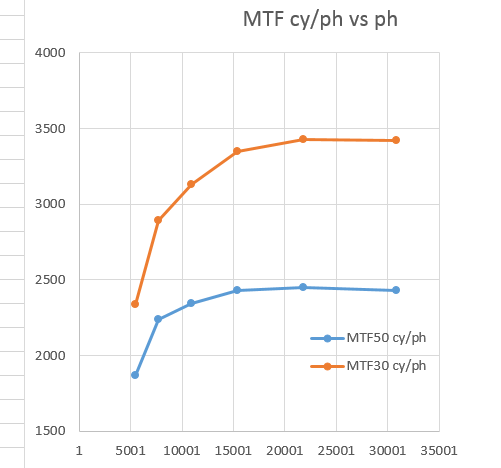
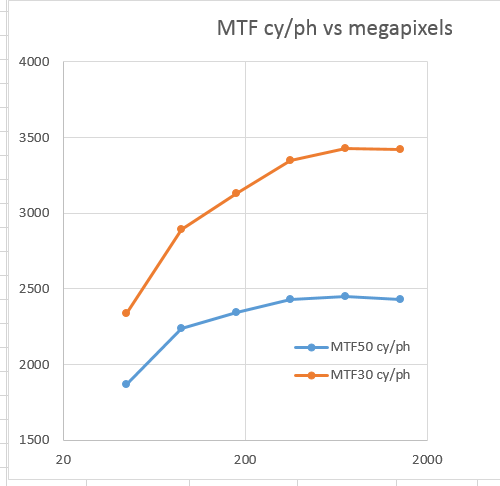
Here is the same MTF50 and MTF30 data plotted against three ways of looking at sensel density:

First vs Q:


Then vs picture height in pixels for a 36x24mm sensor:


And vs sensor megapixels for a 36x24mm sensor:


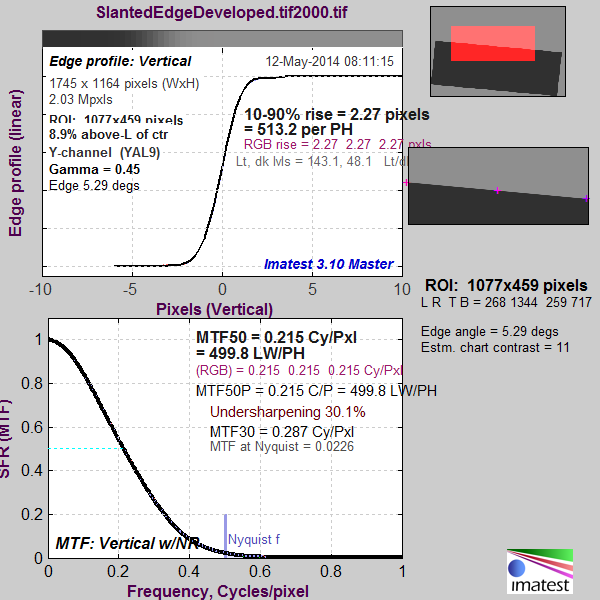
Here is the Q=1 Imatest plot, showing plenty of aliasing:


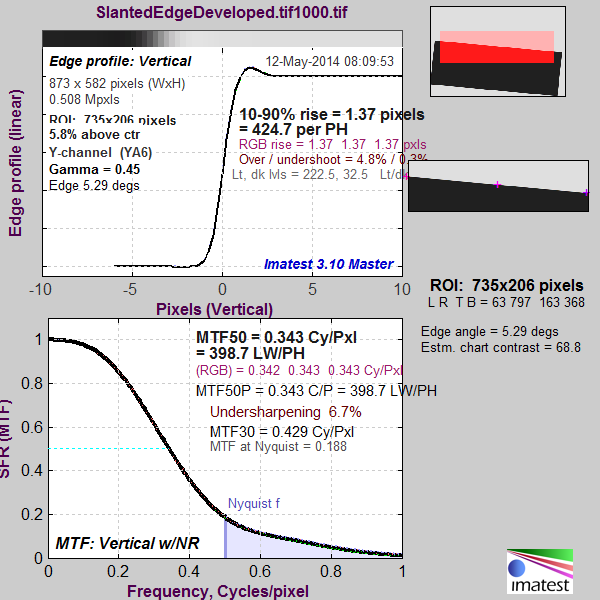
And here's the Q=2 Imatest plot, showing much less as the lens diffraction acts as a pretty good AA filter:


Note that the AA filtering isn't perfect, as it would be in a monochromatic sensor, one with no CFA.

I don't know why Imatest shows different contrast in the thumbnails of the two images; I checked teh files and the contrast is identical.

Jim
« Last Edit: May 12, 2014, 11:51:40 am by Jim Kasson »
Logged

Jim Kasson

  • Sr. Member
  • ****
  • Offline Offline
  • Posts: 2370
    • The Last Word
A graphical look at aliasing
« Reply #38 on: May 12, 2014, 12:46:07 pm »

Here's a graph of the MTF at the Nyquist frequency for the slanted edge charts shown in the above post:


The two right-most points are suspect (the Q=5.7 one obviously so), since the resolution of the simulated camera exceeds the resolution of my test chart for those.

The curves here seem to correlate the visual results with the ISO 12233 charts; Q = 2.8 is enough to get rid of most all false color artifacts, although not quite all aliasing artifacts -- look at a blowup of the ISO 12233 chart at Q=2.828:


Jim

Jim Kasson

  • Sr. Member
  • ****
  • Offline Offline
  • Posts: 2370
    • The Last Word
Re: How much sensor resolution do we need to match our lenses?
« Reply #39 on: May 14, 2014, 02:58:25 pm »

3) Its easy to find out. Do a test of your lens at a variety of aperture settings. A good zoom, probably f8. A prime probably f5.6, a top prime f4, the Otus f2. Further stopping down will give less detail. Wider lens aberrations damage the output.

I tested the Otus, and, as my informal testing had made me believe,  f/2 is not the best aperture. f/5.6 is. Whether any f-stop except f/16 is diffraction-limited will take some more work, but diffraction is clearly adversely affecting f/11.


10 shots at each aperture. Moderate contrast target. a7R, ISO 100, 1/10 sec, trailing curtain synch, Paul Buff Einstein illumination (light output varied to equalize exposure), RRS CF tripod, Arca Swiss C1 cube. Developed in Lr, sharpening and noise reduction turned off.

Jim
« Last Edit: May 14, 2014, 03:03:25 pm by Jim Kasson »
Logged
Pages: 1 [2] 3 4 ... 6   Go Up